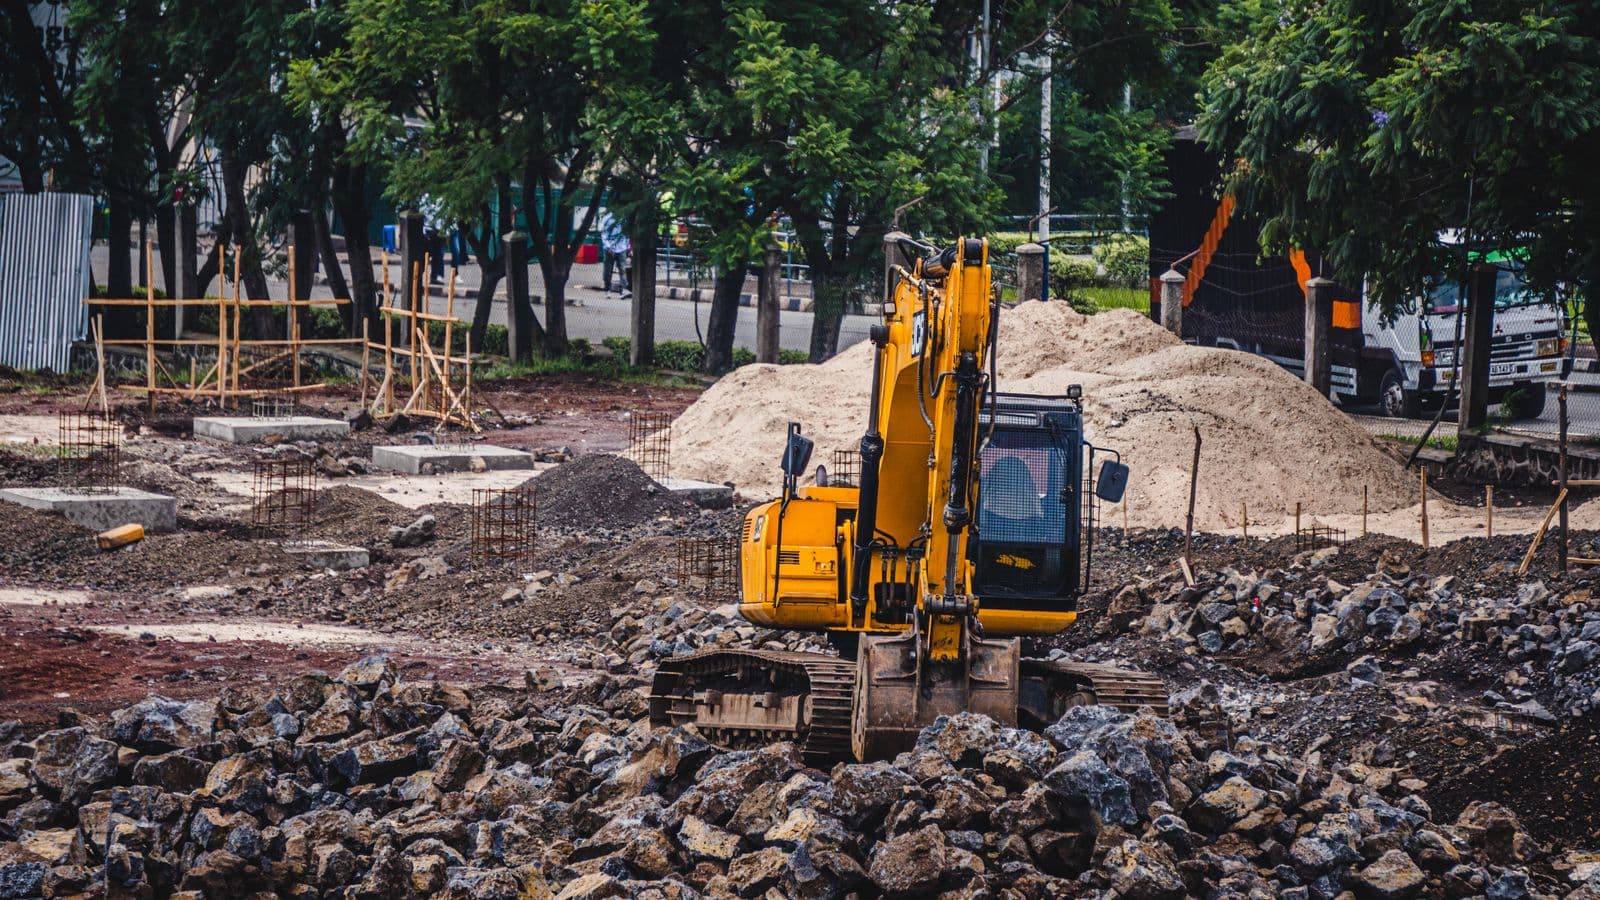
Two contractors buy identical excavators on the same day. Five years later one machine has cost 40% more than the other — same model, same city, same work. The difference lives in the part of the cost iceberg below the waterline, and that part is where parts strategy operates.
The Cost Structure of a Working Machine
Across a typical 10,000–12,000 hour ownership in Saudi conditions, the shape is consistent:
The R&M Curve Is the Whole Game
R&M cost per hour is not flat: it starts low, stays flat through mid-life if PM is honored, then climbs as components reach end-of-life. Two management failures reshape this curve expensively. Deferred maintenance pulls the climb years forward — the skipped hydraulic service that becomes a pump, per every guide in this series. Missed replacement timing rides the curve too long: when a machine's cost-per-hour durably exceeds the cost-per-hour of replacing it, every additional month is a donation. You cannot see either failure without the fleet's most valuable single metric: maintained cost-per-hour, per machine, reviewed quarterly.
The Parts Levers That Cut TCO
Resale Is a Parts Decision Too
Saudi Arabia's used equipment market prices condition visibly: documented service history, healthy undercarriage percentage, fresh GET, working AC, and tidy cabs move auction results by tens of thousands of riyals. The rental industry's refurb math from our rental guide applies to every owner: end-of-life parts spending is often the highest-return parts spending of the machine's whole life.
HESP supports TCO-driven fleets with program pricing, cost-per-hour comparisons on wear parts, exchange components, and consumption reporting that feeds your cost-per-hour reviews. Send us two years of parts history and machine hours; we will show you which levers are loose.